
M & M Math
Event: Elementary Division
Category: General Science (Elementary)
Student: Christian Killingsworth
Table: 410
Experimentation location: Home
Regulated Research (Form 1c):
Project continuation (Form 7):
Abstract:
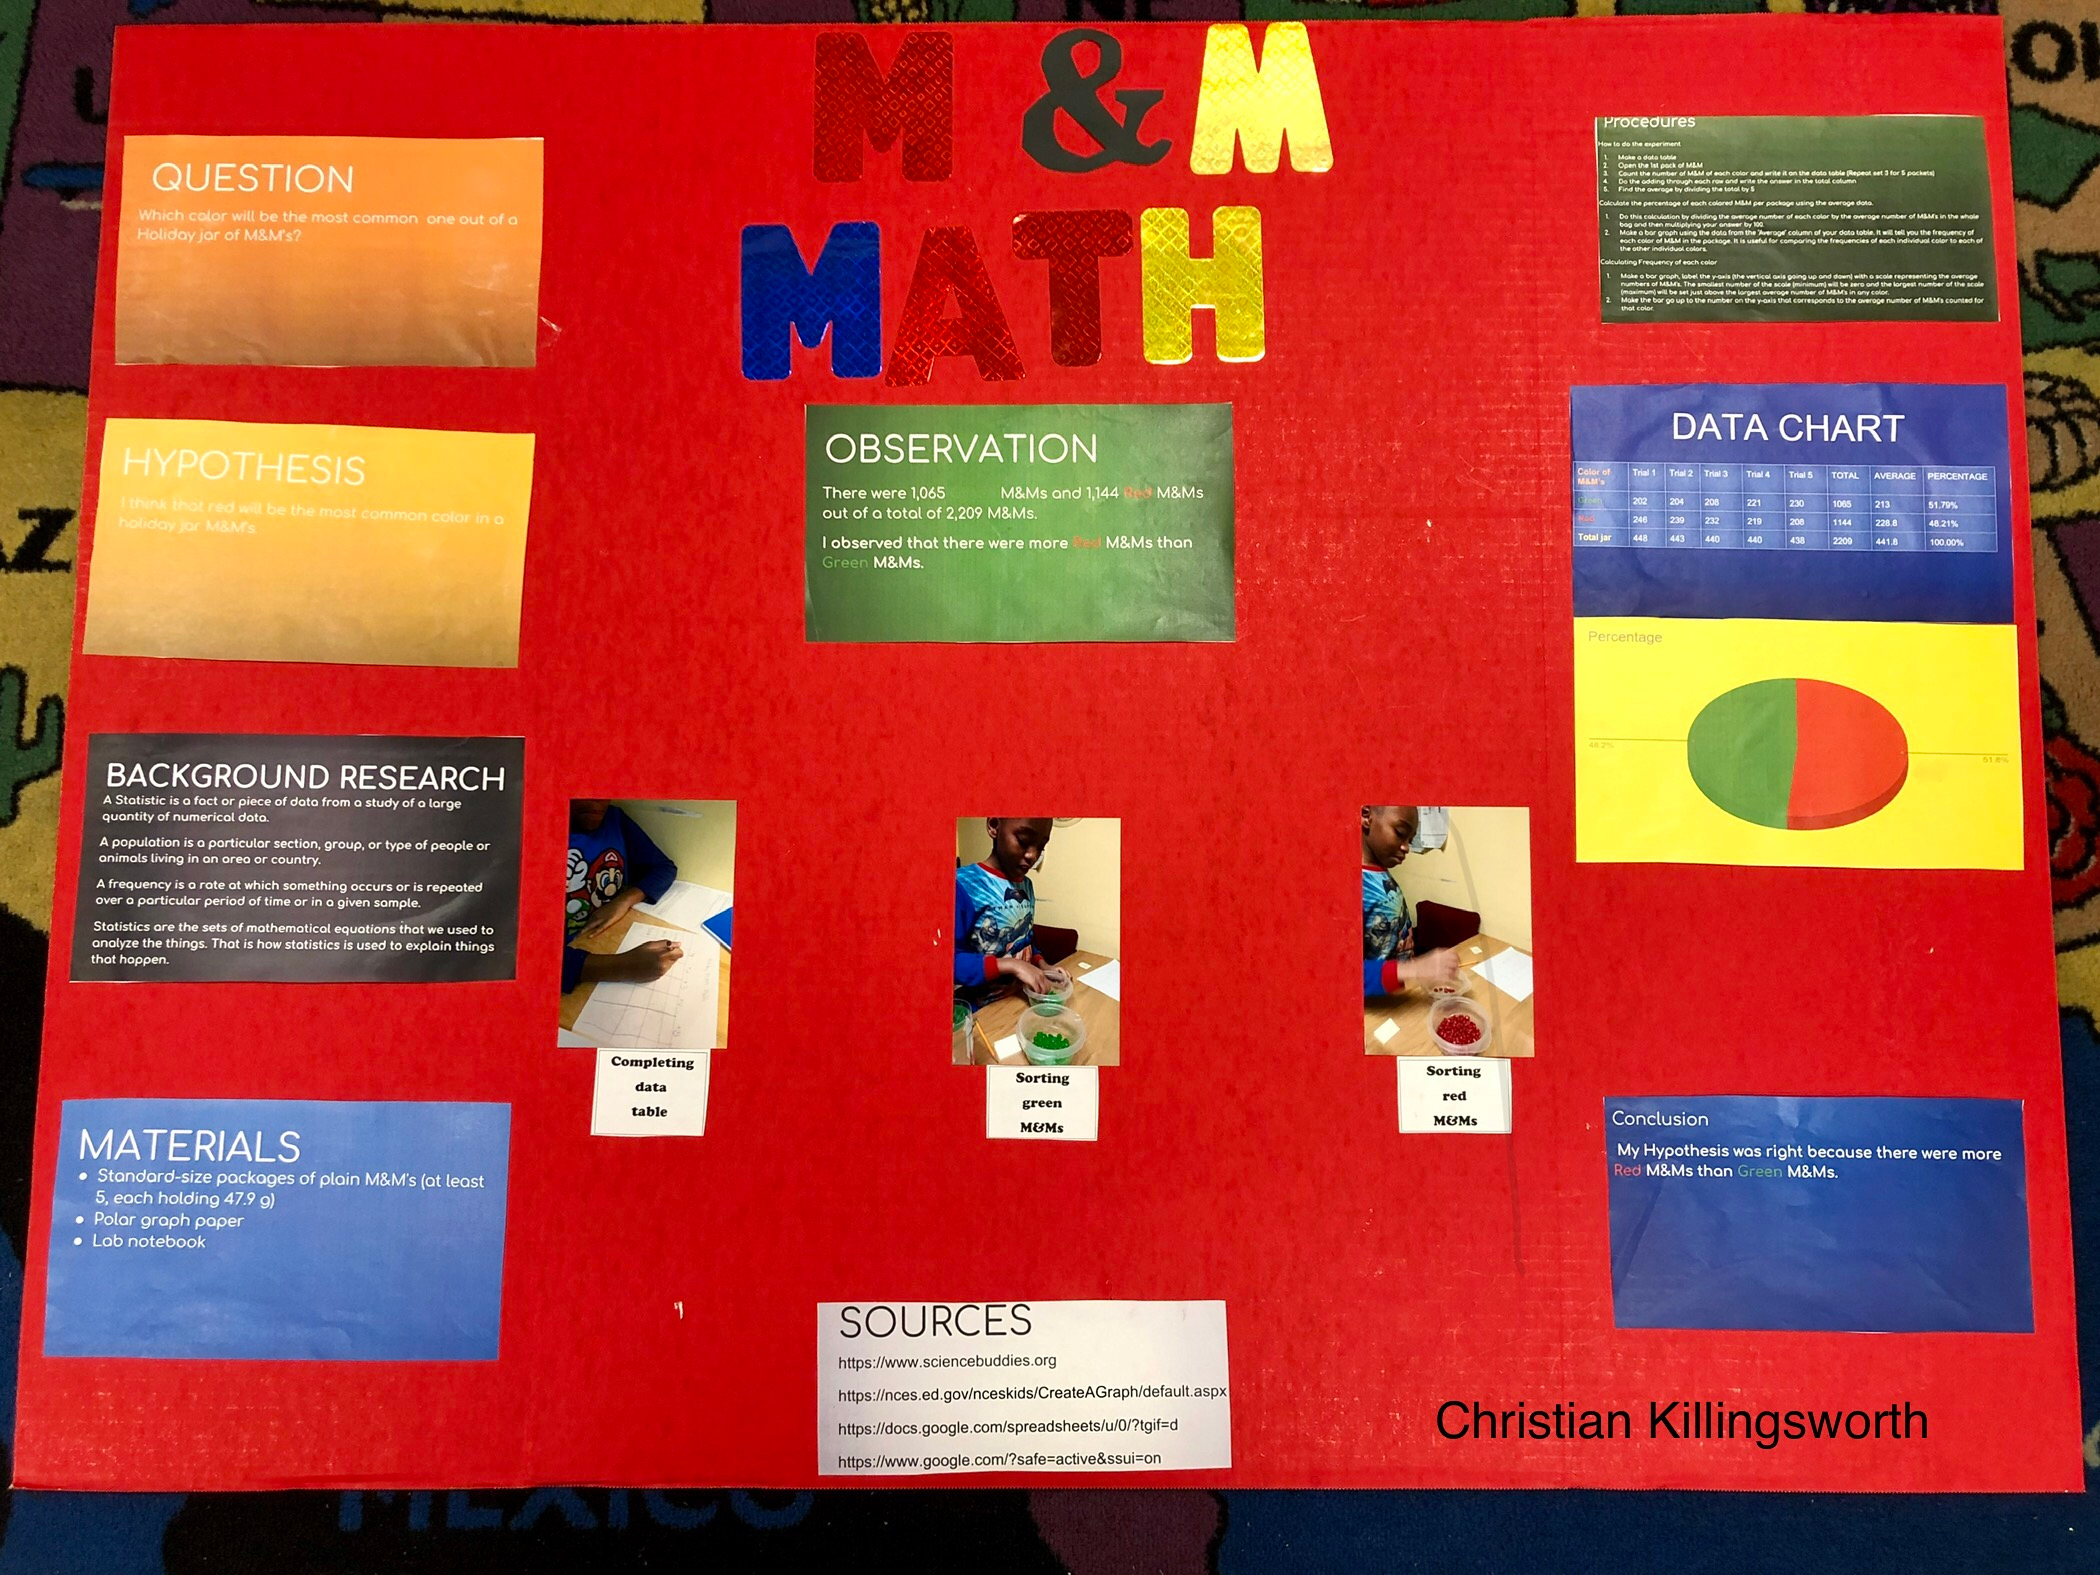
Observation
There were 1,065 Green M&Ms and 1,144 Red M&Ms out of a total of 2,209 M&Ms.
I observed that there were more Red M&Ms than Green M&Ms.
Conclusion
My Hypothesis was correct because there were more Red M&Ms than Green M&Ms.
Bibliography/Citations:
No additional citationsAdditional Project Information
Project website: -- No project website --
Presentation files: -- No files provided --
Research paper:
Additional Resources: -- No resources provided --
Project files: -- No files provided --
Research Plan:
I am going to predict what color m&m is most popular.
●Standard-size packages of plain M&M's (at least 5, each holding 47.9 g) ●Polar graph paper ●Lab notebook
1.Make a data table. 2.Open the 1st pack of M&Ms. 3.Count the number of M&Ms of each color and write it on the data table.(Repeat step 3 for 5 packs) 4.Do the adding through each row and write the answers in the total column. 5.Find the average by dividing the total by 5.