
Automatic deep-learning classification models for breast lesions
Abstract:
Breast cancer vulnerability in women typically increases until they are about 74 years old, and then begins to steadily decline [1]. As of 2019, an estimated 268,600 new cases of invasive breast cancer will be diagnosed among women. While 128.5 out of 100,000 new women are diagnosed with this cancer each year, 20.3 of these women eventually die of the disease. In addition, approximately 41,760 women and 500 men are expected to die from breast cancer this year [1]. Stage 1 breast cancer means that the cancer cells have not spread to other areas from the area [1].Garra et al (1997) discovered that cancerous lesions can be distinguished from benign lesions using a size difference. The results in their paper demonstrated that invasive ductal carcinoma lesions appear larger in strain images compared to conventional B-mode ultrasound images whereas the sizes were approximately the same for benign lesions. Furthermore, malignant lesions exhibited higher contrast than benign lesions. However, size difference was a stronger classification feature. Barr et al (2012) performed a larger study (528 female patients with 635 lesions). In his study, if the ratio was higher than 1.0, the lesion was considered malignant. If the ratio was lower than 1.0, the lesion was considered to be benign. This project is based on the work of Garra et al and Barr et al to automate the classification using these criteria. Diagnosis by radiologists is highly dependent on elastography expertise whereas our algorithm is objective and can help guide a clinician make improved diagnosis.
In our study, we will determine the effectiveness of the apparent lesion-size discrepancy determined by automatic segmentation algorithms between the processed ultrasound B-Mode and strain image of in vivo patient data as a classification criterion between benign fibroadenoma and adenocarcinoma. Furthermore, we will design support-vector machine classifiers based on lesion-size discrepancy, intensity contrast in the elasticity image, and intensity contrast in the B-Mode image, intensity contrast discrepancy to be effective classification models by which to differentiate between fibroadenoma and adenocarcinoma.
Bibliography/Citations:
Bibliography
Center for Disease Control{and}Prevention.USCS Data Visualizations. United States CancerStatistics: Data Visualizations. Library Catalog:gis.cdc.gov. 2017.URL: https://gis.cdc.gov/grasp/USCS/DataViz.html (visited on 07/04/2020).
NIH National Cancer Institute.Cancer of the Breast (Female) - Cancer Stat Facts. SEER. Library Catalog: seer.cancer.gov. 2016.URL: https://seer.cancer.gov/statfacts/html/breast.html (visited on 07/04/2020).
National Breast Cancer Foundation. BreastCancerStage0&Stage1.NationalBreast CancerFoundation. Library Catalog:www.nationalbreastcancer.org.URL:https://www.nationalbreastcancer.org /breast-cancer-stage-0-and-stage-1/ (visited on 07/04/2020).
National Breast Cancer Foundation.Breast Can-cer Stage 4. National Breast Cancer Foundation. Catalog: www.nationalbreastcancer.org.URL: https : / / www . nationalbreastcancer . org /breast-cancer-stage-4/ (visited on 07/08/2020)
Brian S. Garra and E. Ignacio Cespedes. “Elastography of Breast Lesions: Initial Clinical Results”.In: Radiology2021 (1997), pp. 79–86. (Visited 07/04/2020)
Richard G. Barr, Stamatia Destounis, Logan B.Lackey, et al. “Evaluation of Breast Lesions Us-ing Sonographic Elasticity Imaging: A Multicen-ter Trial”. In:Journal of Ultrasound in Medicine31.2 (Feb. 2012), pp. 281–287.ISSN: 02784297.DOI: 10 . 7863 / jum . 2012 . 31 . 2 . 281.URL: http :/ / doi . wiley. com / 10 . 7863 / jum . 2012 . 31 . 2 . 281(visited on 07/04/2020)
Rashid Al Mukaddim, Juan Shan, Irteza EnanKabir, et al. “A novel and robust automatic seed point selection method for breast ultrasound images”. In:2016 International Conference on Medical Engineering, Health Informatics andTechnology (MediTec). 2016 International Conference on Medical Engineering, Health Informatics and Technology (MediTec). Dhaka, Bangladesh:IEEE, Dec. 2016, pp. 1–5.ISBN: 978-1-5090-5421-3.DOI: 10.1109/MEDITEC.2016.7835370.URL: http : / / ieeexploreieee.org / document /7835370/ (visited on 07/04/2020).
Jin J. Breast Cancer Screening: Benefits and Harms. JAMA. 2014;312(23):2585. doi:10.1001/jama.2014.13195
K. M. Kelly, J. Dean, W. S. Comulada, and S.-J. Lee, "Breast cancer detection using automated whole breast ultrasound and mammography in radiographically dense breasts," European radiology, vol. 20, pp. 734-742, 2010.
S. Shapiro, W. Venet, P. Strax, L. Venet, and R. Roeser, "Ten-to fourteen-year effect of screening on breast cancer mortality," Journal of the National Cancer Institute, vol. 69, pp. 349-355, 1982.
S. K. Alam, E. J. Feleppa, M. Rondeau, A. Kalisz, and B. S. Garra, "Ultrasonic multi-feature analysis procedure for computer-aided diagnosis of solid breast lesions," Ultrasonic imaging, vol. 33, pp. 17-38, 2011.
Additional Project Information
Research Plan:
RATIONALE
Breast cancer vulnerability in women typically increases until they are about 74 years old, and then begins to steadily decline [1]. As of 2017, there were 250,520 cases reported for females with breast cancer. While 128.5 out of 100,000 new women are diagnosed with this cancer each year, 20.3 of these women eventually die of the disease [1]. An estimated 12.9% of females are diagnosed with breast cancer at least once in their life; there were about 3,577,264 women diagnosed and living with breast cancer in 2017 in the United States [2]. Stage 1 breast cancer cells remain in the originating tissue and have not yet metastasized into neighboring tissues or into the blood supply. If breast cancer is detected in this early state, the survival rate increases because it is still confined [2]. On the other hand, stage 4 of breast cancer has much more perilous consequences: Stage 4 breast cancer has spread to other parts of the body, such as the brain and lungs [4]. At this stage, the cancer is highly invasive; while women can get treatments to live longer, cancers that are metastatic have a higher risk of having much more severe morbidity and mortality rates associated [4]. Our work is geared towards early-stage malignant lesions, thereby having the ability to save more lives because earlier the detection of breast cancer, the higher the potential for survival. Because so many women in the United States suffer from this genetic disease, it is imperative to develop and enhance methods to diagnose this illness before it invades other tissues, such as medical imaging.
Imaging is important in the diagnosis of patients because it is meant to catch cancers early [8]. Routine screening for breast cancer lowers one’s risk of dying of breast cancer because early-stage cancers are easier to treat than later-stage cancers, and the chance of survival is higher. Studies have shown that women who have routine mammograms have 10% to 25% less chance of dying of breast cancer than women who do not have mammograms [8]. Mammography is considered the standard imaging method for earlier detection and diagnosis of breast cancer [9, 10]. However, there are a number of concerns regarding the method, thus researchers have been looking for alternative imaging methods, such as ultrasound imaging. In [11], authors investigated quantitative descriptors such as morphometric features and acoustic features extracted from ultrasound images to classify benign and malignant breast lesions. They have found the lesion-margin definition, speculation, and border irregularity to be the most useful quantitative descriptors for the classification. The lesion boundaries were manually outlined for the quantitative analysis. However, this method of manual delineation takes time and on a large number of lesions, is impractical. Since the distinguishing features are based on the contour of the lesion, it is necessary to design an efficient and automatic lesion segmentation algorithm with the capability of delineating suspicious lesion boundaries with fine details, in order to implement an automated CAD system for breast cancer classification.
Garra et al (1997) discovered the above size difference for classifying benign and malignant lesions in a study with data from 42 patients [5]. The results in their paper demonstrated that invasive ductal carcinoma lesions appear larger in strain images compared to conventional B-mode ultrasound images whereas the sizes were approximately the same for benign lesions [5]. Furthermore, malignant lesions exhibited higher contrast than benign lesions. However, the size difference was a stronger classification feature. Barr et al (2012) performed a larger study (528 female patients with 635 lesions) [6]. In his study, a size-ratio threshold of 1.0 was established. If the ratio was higher than 1.0, the lesion was considered malignant. If the ratio was lower than 1.0, the lesion was considered to be benign [6]. Of the 635 total lesions that were imaged and biopsied, there were 222 malignant lesions and 413 benign ones. 219 out of the 222 malignant lesions actually had a ratio that was at least 1.0. 361 out of the 413 benign lesions turned out to have which was less than 1.0 [6]. Building upon the work of Garra et al and Barr, we believe that automating the classification using these criteria will help in the screening process of breast lesions, diagnosing patients earlier, and thus increase the survival rate of a patient.
RESEARCH QUESTIONS
- Is there a relationship between the appearance (e.g., texture) of a lesion in a strain image and a B-Mode image and its classification?
- Is there a correlation between the ratio of the area of the lesion in a strain image and a B-Mode image and its classification?
- Is there a correlation between the contrast of a lesion in a strain image and the contrast of a lesion in a B-mode image?
- Is there a way to easily discern the B-Mode boundary for adenocarcinoma and the Strain boundary for fibroadenoma?
PROCEDURES
In this analysis, we use in vivo breast lesion patient data taken using the Ultrasonix Sonix-500RP (Ultrasonix Medical Corporation, Richmond, BC, Canada) commercial ultrasound research interface with a L145/38 probe operating at 10 MHz, the manufacturer-provided nominal value, at the University of Vermont Medical Center (UVM). Each patient gave informed consent for data collection, and the Institutional Review Board (IRB) approved the study. For each lesion, compression was applied manually (freehand) for the RF Data (*.rf) and real-time strain sequences (*.avi) compression. In addition, histological information regarding the lesion including position information, size, and classification/pathological nature was also stored in the data repository. These features provided the ground truth for this analysis. Of the 46 lesions recorded in the database, eleven were classified as adenocarcinoma and eleven as fibroadenoma. These lesions were extensively analyzed and together comprised the training dataset used for the final SVM classifier function.
-
Compute the strain and B-mode sequences from the RF data sequence
- Compute the B-mode image sequence from the RF data sequence
- Estimate the mean strain at a data window using a novel 2-step adaptive stretching algorithm which maximizes the correlation between the pre-compression and post-compression RF echo-signals by iteratively stretching the latter.
- The image is created by sliding the data window to cover the entire data frame.
- From the sequence of strain images, visually inspect the sequence and select one strain image based on how clearly the lesion can be depicted and use it to calculate the lesion area.
- To segment the lesion in strain image, apply two separate segmentation algorithms on the pre-processed images: GrowCut and Active Contour
- GrowCut requires 2 labels:
- one region that is completely inside the ROI (the lesion) and no part of the ROI lies outside of it
- one region that is completely outside the ROI and the entire ROI is inside of this delineated region
- These regions are manually delineated and passed to GrowCut algorithm
- The lesion segmentation results by GrowCut are passed to the Active Contour algorithm, which produced the final segmented image.
- GrowCut requires 2 labels:
-
Segment the lesion in the B-mode image
- The B-mode image from the same frame was selected for segmentation
- The steps listed above were repeated for the B-mode frame.
-
Compute both lesion areas and their ratio.
-
The lesion area can be calculated simply by counting the number of pixels inside the segmented lesion for an image.
- The area ratio can be calculated by dividing the area of the lesion in the strain image by the area of the lesion in the B-Mode image.
-
-
Compute the mean intensity inside and outside the lesion for B-mode and strain images and computed the lesion contrast.
- The contrasts for both the strain and B-Mode images can be computed by averaging the strain values at a homogeneous area inside the lesion and those at a homogenous area at a diagonal distance outside the lesion
- The contrast is the mean intensity inside the lesion divided by the mean intensity at the outside selected region
RISK & SAFETY:
The data came from an IRB-approved study. The data will be used under the rules of the study. This study poses no potential risks to the participants.
DATA ANALYSIS:
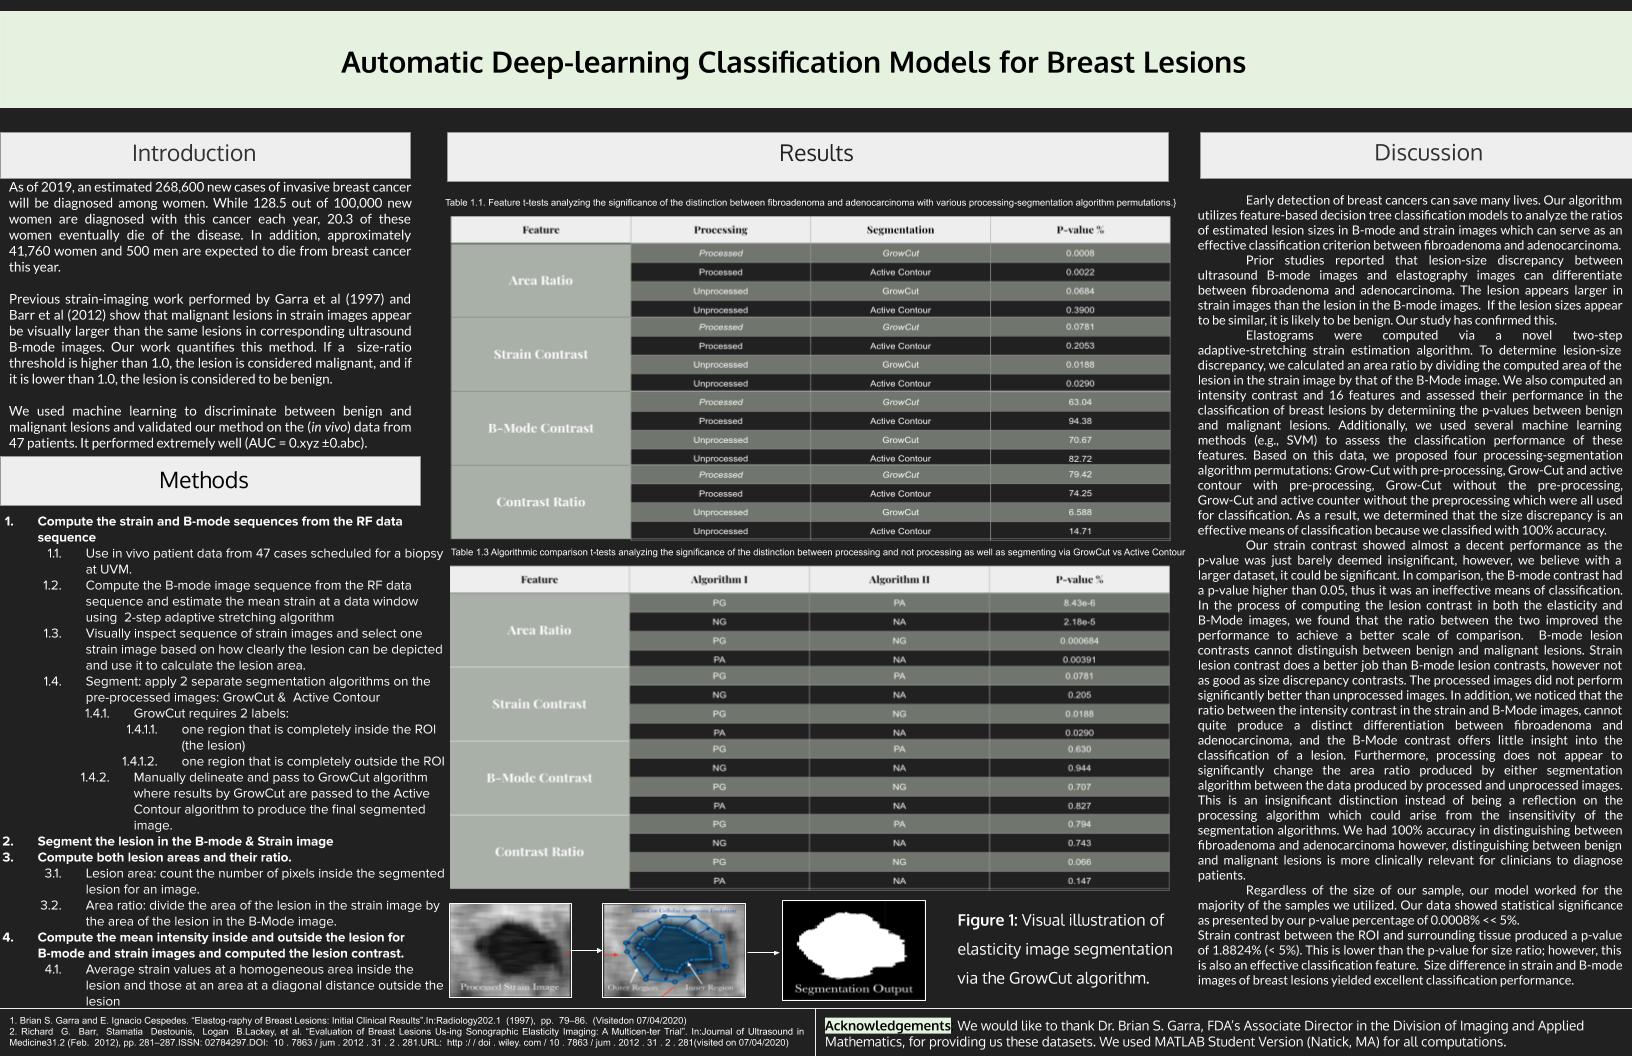
In order to analyze the data/results, we will assess the performance in the classification of breast lesions by determining the p-values for the double-tailed t-tests between benign and malignant lesions and use several machine learning methods (e.g., SVM) to assess the classification performance of these features.
Furthermore, double-tailed t-tests will be computed to quantify the distinction among the four tested processing-segmentation algorithm permutations, and distinctions will be drawn between the data produced by GrowCut and Active Contour segmentation for unprocessed RF echosignals and for processed echosignals to analyze the segmentation procedures and determine the area ratios.
The major impact of the algorithms we designed to compute the size difference in strain and B-mode images of breast lesions is to assist in improving the modern methods radiologists currently utilize to observe lesions in strain images for adenocarcinoma lesions. Our hope is that our work will support our radiologists in their attempt to diminish breast cancer mortality, which is the most common cancer in American women. [2] Our study unlocks many future possibilities for fully automating the size difference in strain and B-mode images of breast lesions, in addition to providing considerable contributions to the field of region growing ultrasound.
BIBLIOGRAPHY
- Center for Disease Control{and}Prevention.USCS Data Visualizations. United States CancerStatistics: Data Visualizations. Library Catalog:gis.cdc.gov. 2017.URL: https://gis.cdc.gov/grasp/USCS/DataViz.html (visited on 07/04/2020).
- NIH National Cancer Institute.Cancer of the Breast (Female) - Cancer Stat Facts. SEER. Library Catalog: seer.cancer.gov. 2016.URL: https://seer.cancer.gov/statfacts/html/breast.html (visited on 07/04/2020).
- National Breast Cancer Foundation. BreastCancerStage0&Stage1.NationalBreast CancerFoundation. Library Catalog:www.nationalbreastcancer.org.URL:https://www.nationalbreastcancer.org /breast-cancer-stage-0-and-stage-1/ (visited on 07/04/2020).
- National Breast Cancer Foundation.Breast Can-cer Stage 4. National Breast Cancer Foundation. Catalog: www.nationalbreastcancer.org.URL: https : / / www . nationalbreastcancer . org /breast-cancer-stage-4/ (visited on 07/08/2020)
- Brian S. Garra and E. Ignacio Cespedes. “Elastography of Breast Lesions: Initial Clinical Results”.In: Radiology2021 (1997), pp. 79–86. (Visited 07/04/2020)
- Richard G. Barr, Stamatia Destounis, Logan B.Lackey, et al. “Evaluation of Breast Lesions Us-ing Sonographic Elasticity Imaging: A Multicen-ter Trial”. In:Journal of Ultrasound in Medicine31.2 (Feb. 2012), pp. 281–287.ISSN: 02784297.DOI: 10 . 7863 / jum . 2012 . 31 . 2 . 281.URL: http :/ / doi . wiley. com / 10 . 7863 / jum . 2012 . 31 . 2 . 281(visited on 07/04/2020)
- Rashid Al Mukaddim, Juan Shan, Irteza EnanKabir, et al. “A novel and robust automatic seed point selection method for breast ultrasound images”. In:2016 International Conference on Medical Engineering, Health Informatics andTechnology (MediTec). 2016 International Conference on Medical Engineering, Health Informatics and Technology (MediTec). Dhaka, Bangladesh:IEEE, Dec. 2016, pp. 1–5.ISBN: 978-1-5090-5421-3.DOI: 10.1109/MEDITEC.2016.7835370.URL: http : / / ieeexploreieee.org / document /7835370/ (visited on 07/04/2020).
- Jin J. Breast Cancer Screening: Benefits and Harms. JAMA. 2014;312(23):2585. doi:10.1001/jama.2014.13195
- K. M. Kelly, J. Dean, W. S. Comulada, and S.-J. Lee, "Breast cancer detection using automated whole breast ultrasound and mammography in radiographically dense breasts," European radiology, vol. 20, pp. 734-742, 2010.
- S. Shapiro, W. Venet, P. Strax, L. Venet, and R. Roeser, "Ten-to fourteen-year effect of screening on breast cancer mortality," Journal of the National Cancer Institute, vol. 69, pp. 349-355, 1982.
- S. K. Alam, E. J. Feleppa, M. Rondeau, A. Kalisz, and B. S. Garra, "Ultrasonic multi-feature analysis procedure for computer-aided diagnosis of solid breast lesions," Ultrasonic imaging, vol. 33, pp. 17-38, 2011.
Questions and Answers
. What was the major objective of your project and what was your plan to achieve it?
The main objective of our project was to develop a semi/automated deep learning classification algorithm of breast lesions. We planned to achieve this by using convolutional neural networks, residual networks, generative adversarial networks, and dimension-fusion-UNets to compute the size difference in strain and B‐mode images of breast lesions as an aid to the diagnosis of breast cancer lesions.
a. Was that goal the result of any specific situation, experience, or problem you encountered?
- In November 2013, our aunt was diagnosed with Stage 3 breast cancer. She had seen her doctor about some puckering on her breast and came back with the most devastating news. My aunt’s diagnosis, and later, her passing, changed the whole dynamic of our family in the years that followed. This is why our team took a particular interest in this specific field: we were personally affected by this issue. Because so many women in the United States suffer from this genetic disease, it is imperative to develop methods to diagnose this illness before it invades other tissues.
b. Were you trying to solve a problem, answer a question, or test a hypothesis?
- We were trying to solve a problem. The problem is that normally, researchers have to manually determine whether a lesion is benign or malignant which takes time and is impractical for a large number of lesions.
2. What were the major tasks you had to perform in order to complete your project?
- Accessing the datasets from certified FDA radiologists.
- Extensive literature review research to discover best segmentation algorithm and create solid foundation of subject
- Annotating the data and selecting the best frames to use for the segmentation algorithm
- Delineate the outer and inner boundaries for GrowCut segmentation
- Use the segmentation algorithm to do the area comparison
- Based on this, calculate the feature contrast for all features (size, intensity)
- With this data, do a threshold fit and determine the threshold for each feature and discriminate each class based on the feature
- Fit an SVM to the data and calculate the threshold for the classifier
a. For teams, describe what each member worked on.
- Sarina Hasan: Accessing the datasets from certified FDA radiologists, research and reading through public scientific literature to find a segmentation algorithm, data annotation and cleanup, selecting the best RF frame from each set of images to use for the segmentation algorithm, helping develop the classification algorithm
- Areeq Hasan: Developing classification algorithm by using the segmentation algorithm to do the area comparison and all the feature contrast algorithms, calculating the feature contrast for all contrasts, and using that to do a threshold fit, determining the threshold for each feature and discriminating each class based on the feature, fitting an SVM to the data and calculating the threshold for the classifier.
3. What is new or novel about your project?
We computed elastograms using a novel two-step adaptive-stretching strain estimation algorithm. For strain estimation, we used a modified two-step adaptive-stretching strain estimation algorithm. The original adaptive stretching algorithm estimated the mean strain at a data window by maximizing the correlation between the pre-compression and post-compression RF echo-signals by iteratively stretching the latter. In the modified algorithm, we computed strain using a zero minimum strain, 1% applied strain, and 4% maximum strain (step 1). In the second step, to compute the final strain map, the mean, minimum, and maximum strain values from the first step are used as the processing parameters for the applied strain, minimum strain, and maximum strain, respectively. This novel two-step approach to adaptive stretching is itself a contribution and in our observation, it produces significantly more robust strain maps than with the single-step approach. From a sequence of images, we selected one strain image based on how clearly the lesion can be depicted and used it to calculate the lesion area. This novel two-step approach to adaptive stretching has never previously been attempted, and we have observed it to produce significantly more robust strain maps than with the single-step approach.
a. Is there some aspect of your project's objective, or how you achieved it that you haven't done before?
- One novel aspect of our project’s objective is that, to our knowledge, a size discrepancy classifier for breast lesion ultrasound has not been implemented before in a classification algorithm.
b. Is your project's objective, or the way you implemented it, different from anything you have seen?
- Based on our knowledge of current public literature review and online research, for the automated method of classification, transfer learning in medical classification contexts has not been thoroughly explored, thus we believe it is a rather novel approach to training an automatic algorithm.
c. If you believe your work to be unique in some way, what research have you done to confirm that it is?
- When reading through publicly and privately accessible scientific literature on this subject during the foundational stage, we did not see much content on transfer learning within the context of medical classification in the papers that we read, or in online searches. Thus, we believe that our work is unique.
4. What was the most challenging part of completing your project?
The most challenging part of completing our project was finding an effective segmentation algorithm to complement our classification methods. We spent a lot of time reading through scientific literature and parsing through the current status of the field to receive reliable information and data to use in our project.
a. What problems did you encounter, and how did you overcome them?
- The biggest problem we encountered was finding a good segmentation algorithm to use that was publicly available. We overcame this problem by doing extensive research in public research sites and reaching out to particular lab groups and teams who published such papers in order to use their algorithm.
b. What did you learn from overcoming these problems?
- From overcoming these problems, we learned how to effectively parse through the current status of the field and scientific literature to gain reliable information and data to use in our project.
5. If you were going to do this project again, are there any things you would you do differently the next time?
We encountered a few limitations in this study. One limitation was that the sample size was not large, and testing on larger samples will make conclusions more reliable. Furthermore, we could have utilized a more diverse distribution of images across various ultrasound probes and hospitals, so that the model generalizes better. If we were going to do this project again, we would address these limitations.
6. Did working on this project give you any ideas for other projects?
Yes, working on this project gave us an idea for a future project. Ultrasound images are frequently selected from videos / frame sequences for classification, but features such as the compression of lesions / displacement under pressure are only semantically encoded in inter-frame deltas and motion vectors. These features could be analyzed and encoded into feature vectors for classification using sequence models such as recurrent convolutional neural networks (RCNN) because they may provide further insights and key details into classifying lesions. Thus, we believe this could be a future project for further advancements for lesion classification to complete in the near future.
7. How did COVID-19 affect the completion of your project?
Given the effect of the global pandemic crisis on communities worldwide, there has never been a more important time than ever that the digital age had to step up to become the world’s only way of functioning. As aspiring computer scientists ourselves, our team wanted to do our part to help in any way we could. Luckily, our project was not hindered by the effects of the coronavirus, as it was completely virtual. Throughout the process, we held Skype meetings with appropriate scientists to access classified datasets and receive feedback, completed the project on our personal computers using relevant softwares such as MATLAB.