
Estimation of Precipitation Rate Using Computational and Statistical Simulations
Abstract:
It is not easy to use a single variable linear regression or simple exponential smoothing to determine the effectiveness of weather forecasts such as temperature or flooding forecast specially when the data pattern is complicated.In order to accurately predict the effectiveness of such a trend, iterative and statistical methods that can determine the status of temperature or flooding in the United States were chosen in this paper. The task of modeling the pattern in a focused period and performing data analysis were performed.
For the analysis, the extreme value theory was used to assess extreme events within probability distributions by quantifying tail behavior. By analyzing the maximum values of samples, it was possible to determine probabilities for extreme events. A comparison was made with events previously observed and analyzed for authenticity. As evident in our observations, lower values of data have much shorter return periods. In other words, they are more likely to reoccur; however, as the values increase for higher precipitation values, the length of the return periods increase exponentially. Therefore, there is a tendency for precipitation values to remain in lower ranges.
Bibliography/Citations:
[1] Chang, Li-Chiu; Shen, Hung-Yu; Chang, Fi-John (2014-11-27). "Regional flood inundation nowcast using hybrid SOM and dynamic neural networks". Journal of Hydrology. 519 (Part A): 476–489. doi:10.1016/j.jhydrol.2014.07.036.
[2] Application of self-organising maps and multi-layer perceptron-artificial neural networks for streamflow and water level forecasting in data-poor catchments: the case of the Lower Shire floodplain, Malawi
[3] Hydrologic Ensemble Prediction EXperiment, an informal yet highly active group of researchers in the field of predictive hydrologic uncertainty
[4]"AMS Glossary". allenpress.com. Archived from the original on 16 July 2012. Retrieved 9 July 2015.
[5] https://nwis.waterdata.usgs.gov/nwis/peak?site_no=03011020&agency_cd=USGS&format=html
[6] https://nwis.waterdata.usgs.gov/nwis/peak?site_no=03011020&agency_cd=USGS&format=ht ml
[7] Numerical Methods of Curve Fitting. By P. G. Guest, Philip George Guest.
Additional Project Information
Research Plan:
The predictability of catastrophic natural disasters is crucial but this task of modeling natural disasters in a focused area and performing data analysis is difficult especially when the data pattern is complex. Extracting patterns from the analytical process to characterize the natural disaster is a difficult job for the researchers.
Using the Gumbel distribution method, this research focuses on the predictability of floods, for they account for a large amount of casualties out of all the natural disasters. By using statistical and computational simulations including a regression analysis using least square method, we investigated the exceedance probability, which is the probability that the event will exceed some critical value. Also the return period corresponding to this exceedance probability was found.
Research Plan / Procedures
Plotting the precipitation frequency curve using Gumbel Distribution
● Gumbel distribution is used to model the distribution of the maximum/minimum of a number
of samples of various distributions.
● Exceedance probability is the probability that the event will exceed some critical value
(usually far from the mean).
● Return period is an estimate of the likelihood of an event to occur. A statistical
measurement based on historic data denoting the average recurrence interval.
● Theoretical probability is the fraction of times we expect the event to occur if we repeat the
same experiment over and over (i.e. flipping a coin and getting heads or tails is each 0.50).
● Estimated probability approaches the theoretical probability as the number of trials gets
larger. It is an approximation of theoretical probability.
● Conceptual Outcomes
○ This research demonstrates the understanding of return periods and frequency
analysis of the natural disaster. We demonstrate the statistical parameters used in
the frequency analysis
● Practical Outcomes
○ We utilized Matlab and MS Excel to make a statistical and computational
analysis.
○ We used statistical distribution methods and regressions in order to create a
frequency curve.
● Computing/Data Outputs
○ Numerical values: Theoretical and estimated return periods
○ Graphical: graph based on the real data, regression, and forecast curves
● Data Collection - Real-time/Daily Data
○ To download data, the National Water Information System (NWIS) web interface
was used.
Questions and Answers
1. What was the major objective of your project and what was your plan to achieve it?
a. Was that goal the result of any specific situation, experience, or problem you encountered?
b. Were you trying to solve a problem, answer a question, or test a hypothesis?
--> Answers to (a) and (b):
- Study hydrologic extremes for design and assessing the impacts of rare climatic events.
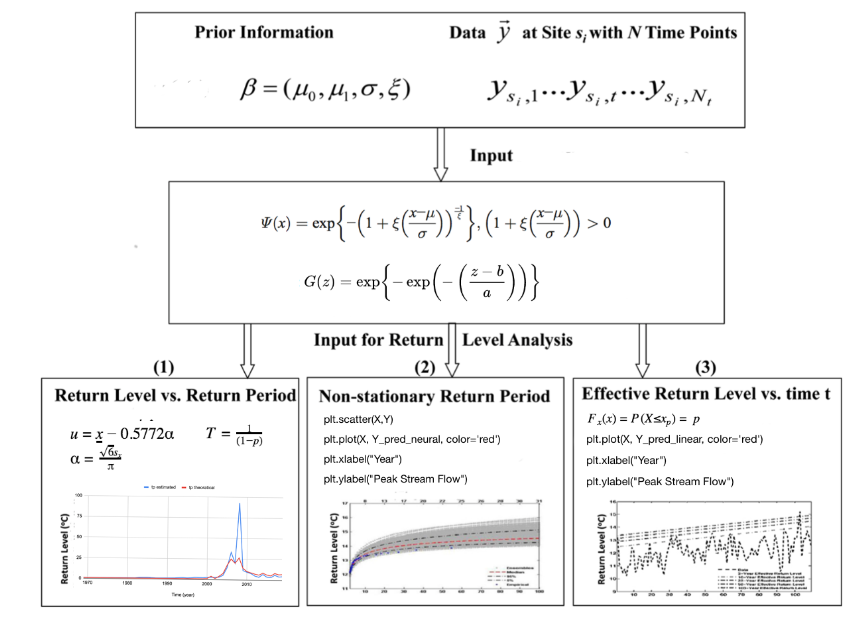
- Introduce a framework for estimating stationary and non-stationary return levels, return periods, and risks of climatic extremes using Bayesian inference.
2. What were the major tasks you had to perform in order to complete your project?
a. For teams, describe what each member worked on.
--> Answers to (a) :
- Find return levels and return periods framework implemented in the non-stationary extreme value analysis , explicitly designed to facilitate analysis of extremes in the geosciences.
- Manage the risks of extreme events and disasters figuring out how the global warming and precipitation would change temporal and spatial pattern of climatic extremes.
3. What is new or novel about your project?
a. Is there some aspect of your project's objective, or how you achieved it that you haven't done before?
b. Is your project's objective, or the way you implemented it, different from anything you have seen?
c. If you believe your work to be unique in some way, what research have you done to confirm that it is?
--> Answers to (a), (b) and (c):
- Theoretical and estimated forecast were found with annual peak streamflow data with respect to a Gumbel distribution. The curve follows the distribution very well for low flows, but starts to drift away from the theoretical at higher flows.
- Estimated probability approaches the theoretical probability as the number of trials gets larger.
- In this paper three major goals such as predicting, modeling, and characterization were studied in order to get a better prediction. Modeling and predicting were performed in an iterative way using Holt's linear exponential smoothing technique with sequential updating equations. Smoothing parameters were used to estimate the level, trend, and seasonality.
4. What was the most challenging part of completing your project?
a. What problems did you encounter, and how did you overcome them?
b. What did you learn from overcoming these problems?
--> Answers to (a) and (b):
Cyclic oscillations such as up-and-down changes were observed in the data. But due to the complexity and de-seasonality of the data that include irregular components, it was not easy to get a general approximation. Due to this challenges, non-linear regression using Fourier series and polynomial regression for the long-term behavior of precipitation data were employed for the presented analysis.
5. If you were going to do this project again, are there any things you would you do differently the next time?
Using better tools and employing manual and mathematical least-sum-of-squares line fit for data smoothing, I would like to remove the noise of the data.
6. Did working on this project give you any ideas for other projects?
n/a
7. How did COVID-19 affect the completion of your project?
n/a