
How Does the Brain See the World - Decoding Visual Stimulus Using fMRI
Abstract:
The visual system is one of the most complicated sensory systems whose encoding of our day-to-day visual stimuli is still a mystery. At the start of the visual processing stream, visual information enters our retina which is later relayed to the thalamus before they finally reach visual cortices. In this project, by using data from the Kay experiment [9], I explored how the different brain areas involved in visual processing encodes different types of visual stimuli, and whether this process shares similarities with principal component analysis (PCA). By correlating brain activities with the images’ projections on principal components (PCs) extracted from the Kay image dataset, I found V1 voxel activities have the highest average correlation with the images’ projections on the first 5 PCs. At the same time, I also found that LatOcc process ‘entity’ images most similarly to PCA among all brain regions.Bibliography/Citations:
- Hesse, Janis K, and Doris Y Tsao. “The macaque face patch system: a turtle's underbelly for the brain.” Nature reviews. Neuroscience vol. 21,12 (2020): 695-716. doi:10.1038/s41583-020-00393-w
- Engel, S. A., Rumelhart, D. E., Wandell, B. A. T., Glover, G. H., Chichilnisky, E.-J., & Shadlen, M. N. “fMRI of human visual cortex.” Nature, vol. 369, no. 6481, (1994): 525.
- Ganis, Giorgio, William L. Thompson, and Stephen M. Kosslyn. "Brain areas underlying visual mental imagery and visual perception: an fMRI study." Cognitive Brain Research 20.2 (2004): 226-241.
- Kay, K., Naselaris, T., Prenger, R. et al. “Identifying natural images from human brain activity.” Nature 452, 352–355 (2008). https://doi.org/10.1038/nature06713
- Simoncelli, E P, and B A Olshausen. “Natural image statistics and neural representation.” Annual review of neuroscience vol. 24 (2001): 1193-216. doi:10.1146/annual.neuro.24.1.1193
- F.R.S., Karl Pearson. “LIII. On lines and planes of closest fit to systems of points in space.” Philosophical Magazine Series 1 2: 559-572.
- Hotelling, H. “Analysis of a complex of statistical variables into principal components.” Journal of Educational Psychology, vol. 24, no. 6, 417–441.
Additional Project Information
Research Plan:
Rationale:
Imagine you are appreciating the work of Picasso in an art gallery; or traveling in a foreign city trying to find your way to a hotel; or accidentally bumping into an old friend recalling what he looked like in the past. Such day-to-day events require complex cognitive functions where visual inputs are essential. These inputs are incorporated in the brain to assist other brain areas and their corresponding functions such as the hippocampus managing memories, the frontal lobe making decisions, and the limbic system controlling emotions. Hence, understanding the visual pathways can not only help the investigation of the visual system of the brain but can also facilitate studies of other functions of the brain including memories, spatial navigation, multi-sensory integration, etc., and these functions’ relationships with the visual pathway, such as what visual input does the hippocampus receive from the visual cortex.
To facilitate these cognitive functions, distinct visual signals are segregated and processed by different means. The retina is the first hub of the visual pathway where different visual information is processed and segregated. There are two mechanisms that the retina adopted to differentiate visual signals —via the same population of neurons responding differentially to different visual input, or via different populations of neurons responding specifically to certain sets of visual stimuli. After the retina, the segregation will be maintained and sent to the visual cortex for further processing. In the visual cortex, different brain areas have their own specialization, such as object-selective neurons that only react to faces will be activated when a face patch appears[1]. As information is processed in the visual string, more specific semantic information is extracted. For example, V1 responds to the direction and movement of light while higher up in the visual stream, areas respond to specific textures and shades.
How can we study such a complex visual system? There are various techniques that have been developed to answer this question. In animal-based neuroscience research, scientists adopt techniques including electrophysiology, microdialysis, and two-photon imaging using whichThey have established the basic knowledge of visual systems. On the other hand, if the research is performed on human subjects, different techniques will be adopted. The most popular one out of all is functional magnetic resonance imaging (fMRI). This technology reveals brain-wide activities through the measurement of blood-oxygen-level-dependent signals, a parameter reflecting the concentration of oxygenated hemoglobin in different areas of the brain through their polarity profile. Compared to animal model-based technologies, fMRI provides insight into brain-wide activities and can be applied on subjects with minimal damages. For example, in 1994, the topography of the human primary visual cortex was measured by fMRI[2]. In addition, in 2004, the maximal degree of shared neural processing in visual mental imagery and visual perception were accessed and investigated through using fMRI[3]. High spatial resolution, which is essential for investigating the encoding of various visual stimuli by specific regions or pathways of the brain, can also be best achieved by fMRI among other technologies. Therefore, in our project, we will be analyzing an fMRI dataset that consists of brain-wide voxel activities in response to various visual stimuli. I hope through this project, I can gain a deeper understanding of the visual pathway understanding which is crucial to both medical and translational applications and day-to-day life technology.
Research Questions:
1) Do different brain regions process different aspects of visual information?
2) Do different brain regions have different degrees of contribution in encoding semantic information carried by a visual stimulus?
3) Are there any statistical properties underlying naturalistic images?
4) Do brain regions encode visual information in a manner similar to principal component analysis (PCA)?
Procedures:
- The Kay dataset[4] is a published fMRI dataset published in 2008 on Nature. In the experiment, human subjects were asked to lay in an fMRI scanner presented with grayscaled natural images of different categories. Meanwhile, their brain activity was recorded using fMRI. In the experiment, Kay repeatedly presented the same image 13 times and presented the subject 1750 different images altogether. The current dataset consists of the average recorded response of each voxel over the 13 repeated presentations. The voxels were aligned with the human brain atlas and the fMRI signals of 7 vision-related areas – V1, V2, V3, V3A, V3B, V4, and lateral occipital cortex – are extracted.
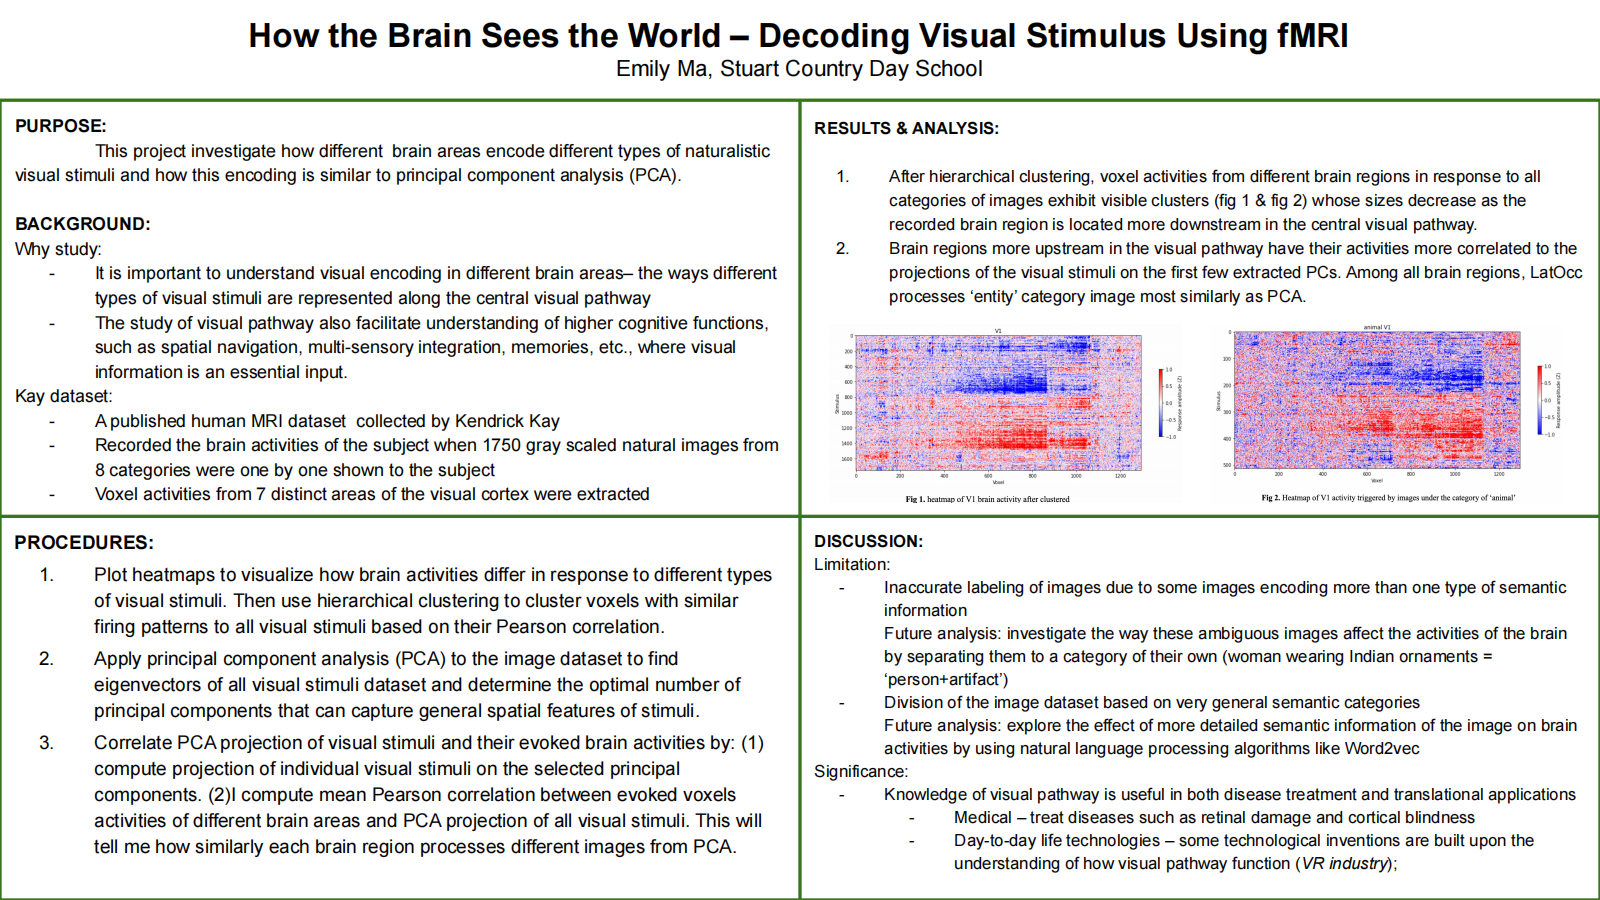
- To visualize how the activities of the brain differ when the subjects are presented with different images, I will plot a heatmap of brain-wide activities, where the x-axis represents the identity of individual visual stimuli, and the y-axis is the voxels number in the visual cortex.
- To further analyze and visualize brain activities, I will plot various heatmaps after dividing the dataset in three different ways: by the brain regions, by the semantic category of visual stimuli, and by both. This will result in 7 heatmaps corresponding to the activities of 7 brain regions in response to all stimuli, 8 heatmaps corresponding to the activities of the whole brain in response to 8 semantic categories of image, and 56 heatmaps corresponding to the activity of 7 brain regions each in response to the presentation of the 8 different semantic categories. To visualize the patterns in the heatmap more clearly and make them more comparable, each voxel will have its amplitude normalized to the range between -1 and 1. By comparing the average, mean, and standard deviation of all heatmaps, we can speculate whether specific brain regions react similarly to all images, whether the activity of the whole brain reacts similarly to images in the same category, and whether specific brain regions react similarly to images in the same category.
- Reorder the dataset to visualize synchronous firing and depression in response to visual stimuli in different brain regions.
- To better visualize correlations between signals, I will use hierarchical clustering to cluster voxels with similar firing patterns to all visual stimuli based on their Pearson correlation.
- Hierarchical clustering clustered voxels that are excited or inhibited synchronously toward individual visual stimuli together. From quantifying the size of the clusters, I can find out how many voxels respond to how many stimuli similarly. If a lot of visual stimuli trigger synchronous firing in voxels, it suggests that the voxels capture more general features of visual stimuli. At the same time, the more voxels fire synchronously, the more voxels are in charge of processing the general features.
- According to previous research, naturalistic images preserve the same hidden statistic representation revealed by PCA[5]. As all images in the Kay dataset are naturalistic images, I will extract principle components from my image dataset using principal component analysis (PCA)[6][7].
-
- In linear algebra, finding eigenvectors of a high dimensional dataset means finding axes where data points have the highest variation. By applying PCA to find eigenvectors of the visual stimulus dataset, I will examine whether there are any hidden statistical patterns across naturalistic images.
-
- Meanwhile, I will compute the explained variance of the visual stimuli dataset to find the optimal number of PCs that can capture the general special features of all visual stimuli. By reconstructing images using different numbers of principal components (PCs), I can confirm the choice of the optimal number of PCs
- Correlate PCA projection of visual stimuli and brain activity.
- I will compute the projection of individual visual stimuli on the number of principal components I selected. This will yield a 10*1750 dataset consisting of the projection of individual images on each of the 10 eigenvectors.
- To find how similarly each brain region processes different images from using PCA, I will compute the mean Pearson correlation between voxels of different brain areas and PCA projection of all visual stimuli.
- Similar to procedure 1.2, I will also investigate correlations between the projections and various subsets of my fMRI data: whole-brain activities responding to all stimuli, activities of different brain regions responding to all stimuli, whole-brain activities responding to different categories of stimulus, and activities of different brain regions responding to different categories of stimulus. The comparison of the correlation coefficient will reveal whether different brain regions encode different categories of images in a similar manner as PCA.
Risk and Safety:
Since this project will only deal with analyzing an online dataset, there are no risk and safety issues.
Questions and Answers
1. What was the major objective of your project and what was your plan to achieve it?
a. Was that goal the result of any specific situation, experience, or problem you encountered?
During the summer, I received a VR headset. I was surprised by how realistic the views were. I was curious about how can such a small headset can create a 3D environment. Therefore, I started researching online about how VR works, and how human vision works. After reading papers and doing research, I determined to investigate how the brain encodes visual stimuli. When looking through investigations of the visual cortex, I found a paper comparing the brain activities with principal component analysis (PCA) of face patch images. This inspired me to do an investigation on how the brain process nature images by also using PCA.
b. Were you trying to solve a problem, answer a question, or test a hypothesis?
This project is designed to answer the question of whether the different brain regions process different types of visual stimuli in distinct ways and whether the mechanism of the brain encoding visual stimuli is similar to principal component analysis (PCA).
2. What were the major tasks you had to perform in order to complete your project?
Before the project, I’ve done a lot of research and read many papers about the visual cortex. This helped me to determine my specific topic and the method I will use to investigate. This is when I found the Kay dataset that I used and decided to compare brain processing visual stimuli with PCA after reading a paper that has done the same thing but with facial images. During the project, all my procedures are carried out through Python. By coding functions, I created new datasets with voxels classified by their brain regions and category of visual stimuli, hierarchically clustered and plotted heatmaps, manually fixed labels and categories of visual stimuli in the dataset, computed PCA and eigen projection, and lastly used Pearson correlation to correlate brain activities of visual stimuli with their corresponding PCs. After collecting data, I analyzed the results and drew conclusions of what information is useful and what results they reveal.
3. What is new or novel about your project?
a. Is there some aspect of your project's objective, or how you achieved it that you haven't done before?
This project is the first time for me to analyze a public dataset using coding techniques. In previous research I have done, I collected data from my own experiments usually through observance, and analyze it by making tables and graphs. In this project, I wrote NumPy functions to make calculations and plotting using an online dataset (the Kay dataset). I faced some difficulties at the beginning since I was not familiar with coding, but after watching tutorial videos and self-learning, I soon mastered coding skills. Moreover, I have not done any experiments about the visual pathway and PCA before this project. I learned a lot on these two areas during the research I have done before starting the project.
b. Is your project's objective, or the way you implemented it, different from anything you have seen?
First of all, previous studies about the brain encoding visual stimuli mainly focused on the pattern of the stimuli, but my project focused on exploring how the visual cortex encodes semantic information of images. Moreover, my project directly compared brain activities and decoding performance of the visual system with a modern machine learning algorithm (PCA) on the same visual stimuli dataset. These two factors made my project novel.
c. If you believe your work to be unique in some way, what research have you done to confirm that it is?
I’ve done tons of research on previous investigations before I started my project. When I search up “visual pathway PCA" in many database search engines such as google scholar and PubMed, I didn’t find one relevant result. When I search "visual cortex semantic information", the results are even less relevant to the investigation I planned to do.
4. What was the most challenging part of completing your project?
a. What problems did you encounter, and how did you overcome them?
A problem I encountered during the development of the project is that the dataset I used contains images and their corresponding labels and content category, but since the labels are autogenerated, many of them are wrong. Part of my project is to investigate whether the content of images affects the way the brain process the images. Therefore, I have to correct all the labels and their categories manually. I first used codes to print out 100 images at a time with their labels and substituted the wrong labels with the correct ones. I repeated this step 18 times since there are 1750 images, and went over all 1750 images and labels. Plus the fact that some images are blurred, the process took a very long time and lots of effort. Then, I also need to make sure the categories are correct since I will divide images into different groups based on their categories in my project. Though spending tens of hours, I successfully corrected all of them, and my project successfully went on. However, as the project developed, I realized that I didn’t need to fix the labels of the images because I am only using the categories of the images.
Besides the problem of project development, multi-tasking and managing my time is also a challenge I faced. As a Junior, I have a relatively dense amount of school work. Therefore, balancing schoolwork and this project was a challenge for me at the beginning.
b. What did you learn from overcoming these problems?
Through spending hours on fixing labels that are not actually necessary, I learned to plan more detailedly beforehand. This error was because instead of planning clearly about what I will do during the process, I only had a thought that I will be using the labels, so I need to fix all of them. For the next time, I will make sure I have a detailed plan of what my goal is before taking action.
For the difficulties of balancing my tasks, though feel very pressured at the beginning, I soon adapted to multi-tasking, performing well on both schoolwork and this outside school project. This opportunity had forced me to stop procrastinating and do my work more efficiently.
5. If you were going to do this project again, are there any things you would you do differently the next time?
First, I would improve my time management skill next time. After realizing how much work this project needs, I can average my working time more evenly. For example, I would write the sections of my paper right after I collected a section of data. This would help me to spread out the writing works during the project, instead of piling them up at the end, when I forget about some of the thoughts I had. Moreover, if I were to do this project again, I would be able to research and learn more purposefully before the experiment. For the first time I do this project, I spent much time hesitating about which topic I will investigate, and researched a lot of background information that are not necessary for my final project. This knowledge is definitely beneficial to know about, but in this limited amount of time, if I could do this project again, I would directly research my focus, which could save lots of time and also give me a clearer train of thought. Last but not least, with some of the research time and paper writing time saved, I would carry out some of my "further investigations" if I could do this project again. Some of the further investigations, such as analyzing semantic information by Word2vec, were completely doable in my project. However, the time-wise urgencies and the pressure from school works and my other activities limited me from investigating deeper.
6. Did working on this project give you any ideas for other projects?
One of the limitations in this project is that some image labels are not very precise because I was unable to identify the content of them due to the level of complexity of the semantic information they carry. For example, there is an image of an old man with two children, and all of them wore cowboy hats, which makes it difficult for me to assign it into either the ‘person’ or the ‘entity’ category. Another project I can do is to further analyze how these ambiguous images affect the activities of the brain by separating them into a category of their own, e.g. a woman wearing Indian ornaments can be assigned to the category of “person+artifact”.
7. How did COVID-19 affect the completion of your project?
Since my project is all about programming and analyzing online resources, COVID-19 did not affect much on my project.