
Identifying the Severity of Knee Osteoarthritis Utilizing Machine Learning
Abstract:
Bibliography/Citations:
Dillon, Charles F., et al. "Prevalence of knee osteoarthritis in the United States: arthritis data from the Third National Health and Nutrition Examination Survey 1991-94." The Journal of rheumatology 33.11 (2006): 2271-2279.
Cui, Aiyong, et al. "Global, regional prevalence, incidence and risk factors of knee osteoarthritis in population-based studies." EClinicalMedicine 29 (2020).
Stoddart, Jennifer C., et al. "The compartmental distribution of knee osteoarthritis–a systematic review and meta-analysis." Osteoarthritis and Cartilage 29.4 (2021): 445-455.
Dong, Ke, et al. "MobileNetV2 model for image classification." 2020 2nd International Conference on Information Technology and Computer Application (ITCA). IEEE, 2020.
Tian, Youhui. "Artificial intelligence image recognition method based on convolutional neural network algorithm." IEEE Access 8 (2020): 125731-125744.
Theckedath, Dhananjay, and R. R. Sedamkar. "Detecting affect states using VGG16, ResNet50 and SE-ResNet50 networks." SN Computer Science 1 (2020): 1-7.
“Knee Osteoarthritis Dataset with Severity Grading.” Kaggle, https://www.kaggle.com/datasets/shashwatwork/knee-osteoarthritis-dataset-with-severity/data. Accessed 21 January 2024.
Thomas, Kevin A., et al. "Automated classification of radiographic knee osteoarthritis severity using deep neural networks." Radiology: Artificial Intelligence 2.2 (2020): e190065.
Additional Project Information
- Knee Osteoarthritis Dataset
Project files
Research Plan:
- Rationale:
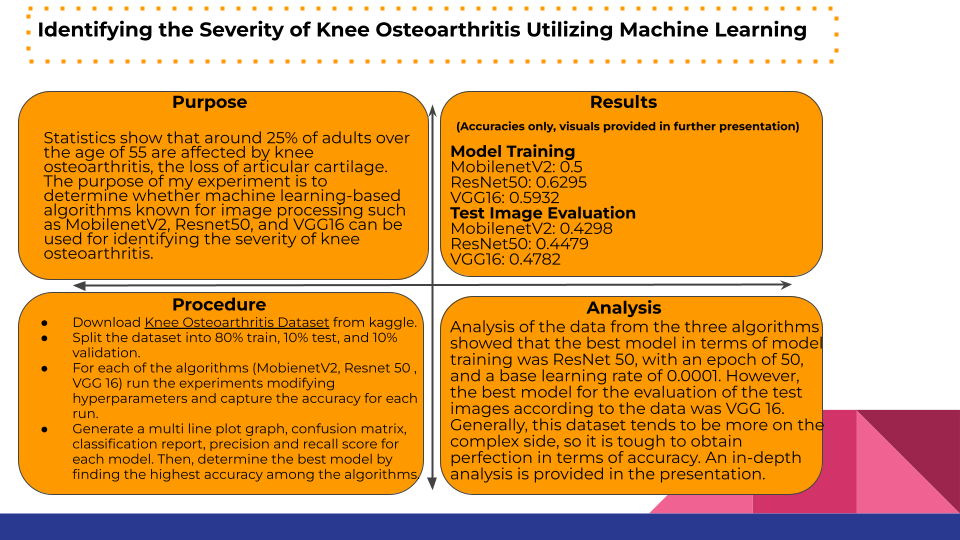
Knee osteoarthritis is the gradual, progressive process in the loss of articular cartilage. Specifically to adults of older age, it is an issue throughout the world in many areas. For example, approximately 25% of people 55 years of age or older have had knee pain on most days in a month for the past year, and about half of them have radiographic osteoarthritis in the knee, a group considered to have symptomatic osteoarthritis. Furthermore, approximately 654 million individuals aged 40 years and older were affected by knee osteoarthritis globally in 2020, highlighting the significant burden this condition imposes. The development of an automated system for the analysis and detection of knee osteoarthritis could offer substantial benefits, not only to medical associations, but also to local communities worldwide.
- Research Question:
I have made the decision to experiment with knee osteoarthritis using machine learning with the modification of hyperparameters in a specified CNN algorithm, with the question of: Which hyperparameter measures corresponded with this dataset through 3 unique image recognition algorithms would result in efficiency and high accuracy? Or in other words: Can I train a consistent neural network algorithm that is highly known for great performance in image recognition, resulting in an accurate way of classifying an x-ray of a knee’s severity in terms of osteoarthritis?
- Materials:
Computer consisting of the following resources:
- TensorFlow - Machine learning platform
- Google Colab - Python coding platform
- Google Suite for documentation and data storage
- Mendely.com - Data source
- Matplotlib.pyplot - For generating graphs
- Procedure:
- Download the data from the following dataset, and upload it on google drive: Knee Osteoarthritis Dataset
- Split the data into train, test, and validation. The split should be 80% train, 10% test, and 10% validation. Modify the data into non-Kellgren-Lawrence grading scale format* only if necessary. An elaboration on this is given at the end of the procedure.
- As the advent of the model training, experiment with the MobilnetV2 algorithm against the train and validation datasets, constantly modifying the hyperparameters of epochs, base learning rate, and batch size. When each google colab run is completed, record the experimental results on a google spreadsheet. One example of this corresponds to the image below.
- Run the code for a wide hyperparameter spectrum of your choosing. It should be in the following range:
- Epochs: 10-50
- Learning rate: 0.000001 - 0.05
- Batch size: 32
- You could experiment with a larger variety of hyperparameters as well, for more potential best models. This process will require an extensive duration of time.
- With the results, generate a multi-line plot graph utilizing matplotlib. This helps with the further evaluation as well as depiction of the data. Examples are provided in the next set of slides.
- Along with your graph, generate various forms of your data, displaying the accuracy. Examples include a confusion matrix, classification report, and precision/recall score. All of this should be executed with the test dataset, and a saved best model in your google drive for valid, viable results.
- Switch the algorithm to ResNet50, and repeat steps #3 - 6
- Switch the algorithm to VGG 16, and repeat steps #3 - 6
- Compare and contrast the best models and their corresponding algorithms, then determine the best model among the algorithms.
- Convert the best algorithm’s model (.h5) into an .onnx file.
- Lastly, deploy this model as a REST API so that anyone in the world with an internet connection can access it. I used AWS lambda and AWS Gateway to achieve this.
*The Kellgren-Lawrence grading scale evaluates osteophytes and joint space narrowing to assign a score between 0 (no ROA) to 4 (severe ROA) (1, 2, 3). In other words, it evaluates a specified skeletal image and provides it with a designated grade, a number ranging from 0 to 4, in order of severity. 0 would signify no sign of osteoarthritis, while 4 would indicate and represent a severe source of osteoarthritis in the x-ray. I originally planned on experimenting with this utilizing machine learning, however the inaccurate results caused me to revert to a generic categorization.
Risks and Safety:
This experiment is conducted entirely through a device, and does not include any experimentation in relation to dangerous activities. Therefore, there would be no risks and safety, or caution notices.
- Data Analysis: Describe the procedures you will use to analyze the data/results that answer research questions or hypotheses
Proceeding towards the data analysis, you can evaluate the results in your own interpretation. However, it is suggested towards the general experimental structure that you should state the hyperparameters with the best performance, as well as their corresponding accuracy. This is crucial towards further data analysis because precise measures are necessary for a successful experiment. I developed my conclusion by partially approving my hypothesis gradually throughout the data analysis, however the conclusion could be presented in another way as well.
Questions and Answers
1. What was the major objective of your project and what was your plan to achieve it?
The major objective of this experiment is to identify the severity of knee osteoarthritis in a x-ray image utilizing machine learning and convolutional neural network(CNN) image processing algorithms. Essentially, I think that experimenting and tinkering with the hyperparameters given to CNN algorithms would result in an efficient, machine learning-based model that is capable of identifying risk and severity of knee osteoarthritis in an x-ray.
a. Was that goal the result of any specific situation, experience, or problem you encountered?
Not necessarily, however, my research prior to this experiment has emphasized the significant impact and burden that knee osteoarthritis offers. For instance, approximately 25% of people 55 years of age or older have had knee pain on most days in a month for the past year, and about half of them have radiographic osteoarthritis in the knee. Also, I knew that the utilization of artificial intelligence is growing in terms of popularity due to the power of A.I.
b. Were you trying to solve a problem, answer a question, or test a hypothesis?
The experiment outcome would be proving or disproving my hypothesis, and therefore forming a conclusion based off of it. My hypothesis was formulated off of prior knowledge, research, and other additional evidential rationale.
2. What were the major tasks you had to perform in order to complete your project?
Some constituent tasks towards the experiment that were crucial in terms of this project were following my procedure, which was meticulously written and designed. Also, selecting a fairly accurate dataset for analysis of the algorithm was a major aspect because it played a crucial role in determining the accuracy.
a. For teams, describe what each member worked on.
N/A(Independent - No teams)
3. What is new or novel about your project?
My experiment is unique because I used three different CNN algorithms to compare and conclude my hypothesis. Also, it is different considering the giant spectrum of visual representations of the data, which offer different interpretations towards the analysis. These include accuracy depictions of the CNN algorithm such as a chart of each hyperparameter combination used in experimentation, a three-way multi-line plot graph monitoring the chart’s data and providing a visual representation of each combination and their corresponding accuracies, a confusion matrix utilized for accuracy clarification as well as another visual representation, offering a different interpretation. These along with a classification report as well as a precision/recall score were used to analyze the results.
a. Is there some aspect of your project's objective, or how you achieved it that you haven't done before?
Initially, I was not familiar with the concept of knee osteoarthritis. I simply came across the dataset during my research. I thought that the medical aspect of the data was interesting to learn more about. Since I was also already learning the concepts of image processing algorithms prior to this experiment, I decided to implement that into my experiment.
b. Is your project's objective, or the way you implemented it, different from anything you have seen?
My project is different in the way it is implemented from other experiments similar to mine. I took the approach of comparing three unique CNN image processing algorithms and classifying the severity of an x-ray image using the categories of “Healthy”, ”Mild”, and ”Severe” to analyze the results and form a conclusion.
c. If you believe your work to be unique in some way, what research have you done to confirm that it is?
My project includes experimenting with the hyperparameters of 3 different CNN algorithms, which is not very common in terms of experimentation. I have researched many experiments in relation to mine, and I believe that my experiment can be viewed as unique in terms of the various forms of data depictions provided that offer different interpretations and perspectives of looking at the visual representations of the data. Many factors and components throughout my experiment including this one make it unique.
4. What was the most challenging part of completing your project?
One challenging part of this experiment was the complexity of the dataset. Since the dataset consisted of images that tend to be more complex, it was tough to obtain perfection in terms of accuracy in terms of each algorithm throughout the experiment.
a. What problems did you encounter, and how did you overcome them?
As I have already mentioned, one challenging part of this experiment was the complexity of the dataset. It progressively began to be a larger problem throughout the experiment, affecting the results as well as the analysis. Overcoming this required tactics that I used such as data augmentation, a larger spectrum of hyperparameters, different image processing algorithms, and eventually I settled on changing the categorical classifications to be more concise and broad: “Healthy”, “Mild”, and “Severe”. I was originally experimenting with classifying the severity utilizing the kellgren-lawrence system, a severity grading scale ranging from numbers from 0-4, 0 indicating no sign of osteoarthritis in the knee, and 4 signifying severe osteoarthritis.
Another issue that I faced many times while running the experiments was the GPU limitation on google colab (Coding platform used to run experiments). Because of this, the experiments would stop midway, leading to incomplete runs. I switched to a paid version of google colab to overcome this problem.
b. What did you learn from overcoming these problems?
While overcoming this problem, I learned many things such as the process of data augmentation, which is essentially duplicating each sample of dataset images and modifying factors such as the angle viewed. This facilitates the analysis of the CNN algorithm.
I also learned to reflect on time management, prioritization, and thinking of alternate solutions when an error occurs.
5. If you were going to do this project again, are there any things you would do differently the next time?
As the dataset complexity turned out to be a problem throughout the project, one thing that I would do differently next time would be to recognize and react to this problem ahead of time. Therefore, it would not cause me to restart the experiment. I would also check for dataset confirmation as well. Significant factors in the dataset itself could be used in this process such as the number of images, and the comments and recommendations of others.
6. Did working on this project give you any ideas for other projects?
Working on this project has inspired me to expand my knowledge on A.I and use it to formulate other experiments in relation to some of my interests such as math, STEM, and music.
7. How did COVID-19 affect the completion of your project?
This experiment is conducted entirely at home. Therefore, COVID-19 did not affect or interfere with my experiment.