
Quantifying Protein Values of Ultraviolet Light Exposed Saccharomyces Cerevisiae
Abstract:
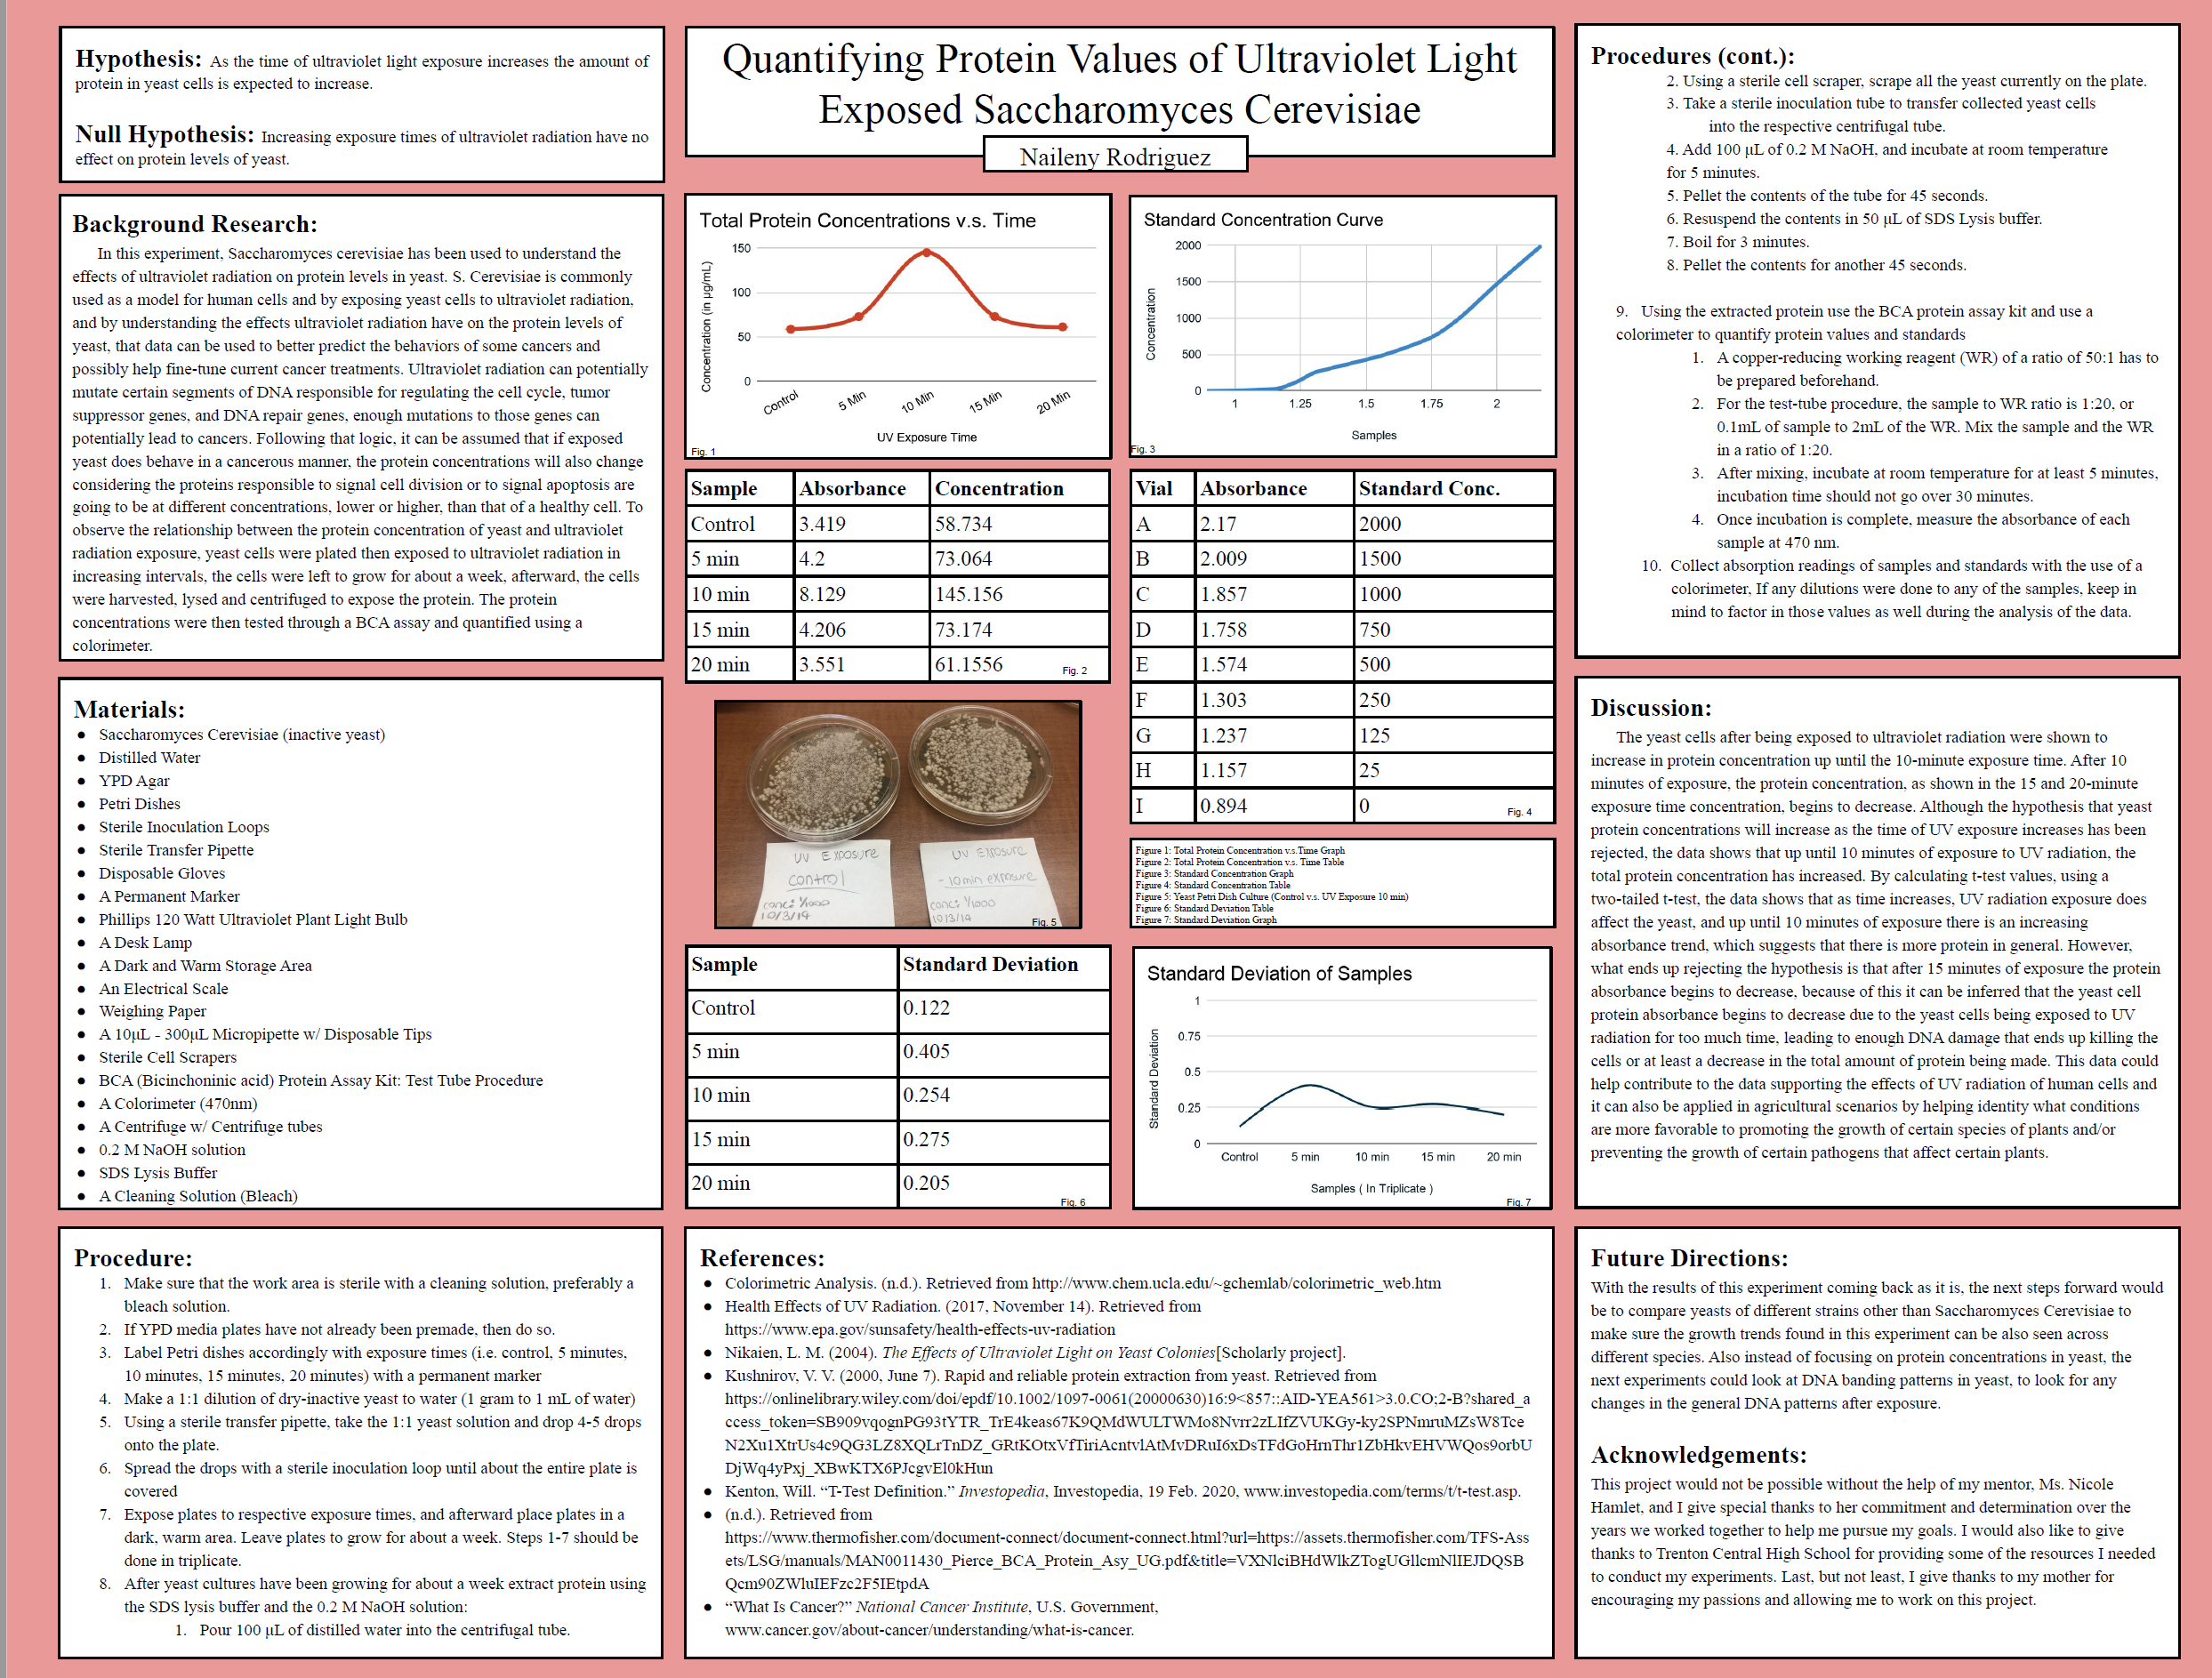
It is well-known that ultraviolet radiation can cause damage and/or mutations in DNA. Because of the damage and/or mutations in DNA, there is a chance that there could be a change in cell protein levels. In this project, I explored the relationship between protein levels in yeast and increasing intervals of time of UV exposure. The level of protein exposed by ultraviolet radiation is expected to increase as the time intervals of exposure increase. Yeast cells were cultured through YPD agar plates, given about a week to grow, and then extracted the protein with an SDS( sodium dodecyl sulfate) lysis buffer and NaOH solution. To quantify and analyze protein values in UV light exposed yeast, a BCA (Bicinchoninic acid) assay was used. After quantifying and analyzing the data, I conclude that UV light exposed yeast protein concentrations did increase from 5 to 15 minutes of exposure, but after 20 minutes of exposure yeast protein concentrations began to decrease. We can infer through this data that UV light exposure from any time interval can mutate or damage DNA to the point that it could mutate enough to become cancerous or die-off from the damage, but after exposure times reach at least 20 minutes cells will begin to die off, resulting in a lower protein count. This data can help further support the carcinogenic effects of ultraviolet radiation and help further develop a protein-based treatment that targets the types of proteins responsible for tumor development.Bibliography/Citations:
No additional citationsAdditional Project Information
Research Plan:
Question: Will protein levels in Saccharomyces cerevisiae protein levels increase as exposure times to ultraviolet light increase?
Hypothesis: As the time of ultraviolet light exposure increases the amount of protein in yeast cells is expected to increase.
Null Hypothesis: Increasing exposure times of ultraviolet radiation does not affect protein levels of yeast.
Methods and Materials:
Materials:
- Saccharomyces Cerevisiae (inactive yeast)
- Distilled Water
- YPD Agar
- Petri Dishes
- Sterile Inoculation Loops
- Sterile Transfer Pipette
- Disposable Gloves
- A Permanent Marker
- 120 Watt Ultraviolet Plant Light Bulb
- A Desk Lamp
- A Dark and Warm Storage Area
- An Electrical Scale
- Weighing Paper
- A 10μL - 300μL Micropipette w/ Disposable Tips
- Sterile Cell Scrapers
- BCA (Bicinchoninic acid) Protein Assay Kit: Test Tube Procedure
- A Colorimeter (470nm)
- A Centrifuge w/ Centrifuge tubes
- 0.2 M NaOH solution
- SDS Lysis Buffer
- A Cleaning Solution
Methods:
- Make sure that the work area is sterile with a cleaning solution, preferably bleach.
- If YPD media plates have not already been premade, then do so.
- Lable Petri dishes accordingly with exposure times (i.e. control, 5 minutes, 10 minutes, 15 minutes, 20 minutes) with a permanent marker.
- Make a 1:1 dilution of dry-inactive yeast to water (1 gram to 1 mL of water).
- Using a sterile transfer pipette, take the 1:1 yeast solution and drop 4-5 drops onto the plate.
- Spread the drops with a sterile inoculation loop until about the entire plate is covered.
- Expose plates to respective exposure times, and afterward place plates in a dark, warm area. Leave plates to grow for about a week. Steps 1-7 should be done in triplicate.
- After yeast cultures have been growing for about a week extract protein using the SDS lysis buffer and the 0.2 M NaOH solution.
- Using the extracted protein run a BCA protein assay and use a colorimeter to quantify protein values and standards.
- Collect absorption readings of samples and standards with the use of a colorimeter, If any dilutions were done to any of the samples, keep in mind to factor those values as well.
Data Analysis:
After data is quantified, the data is analyzed by calculating: total protein values, mean values, and a t-test is performed to make sure that there is a significant distance between two mean groups. Sample absorbance readings are plotted against the standards curve, any trends in the protein level concentration should be seen at this point.
References:
- Health Effects of UV Radiation. (2017, November 14). Retrieved from https://www.epa.gov/sunsafety/health-effects-uv-radiation
- Nikaien, L. M. (2004). The Effects of Ultraviolet Light on Yeast Colonies[Scholarly project].
- Kushnirov, V. V. (2000, June 7). Rapid and reliable protein extraction from yeast. Retrieved from https://onlinelibrary.wiley.com/doi/epdf/10.1002/1097-0061(20000630)16:9<857::AID-YEA561>3.0.CO;2-B?shared_access_token=SB909vqognPG93tYTR_TrE4keas67K9QMdWULTWMo8Nvrr2zLIfZVUKGy-ky2SPNmruMZsW8TceN2Xu1XtrUs4c9QG3LZ8XQLrTnDZ_GRtKOtxVfTiriAcntvlAtMvDRuI6xDsTFdGoHrnThr1ZbHkvEHVWQos9orbUDjWq4yPxj_XBwKTX6PJcgvEl0kHun
- Kenton, Will. “T-Test Definition.” Investopedia, Investopedia, 19 Feb. 2020, www.investopedia.com/terms/t/t-test.asp.
- “What Is Cancer?” National Cancer Institute, U.S. Government, www.cancer.gov/about-cancer/understanding/what-is-cancer.