
The Relationship Between Media Bias and Political Views of US Adults
Abstract:
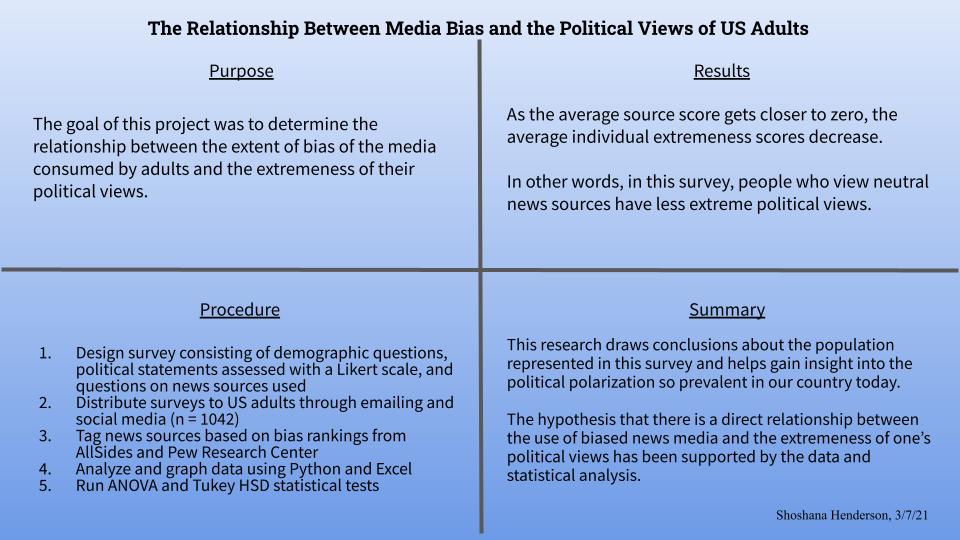
The goal of this project was to determine the relationship between the extent of bias of the media consumed by adults and the extremeness of their political views. American adults (n =1041) were surveyed and asked demographic questions, given a series of seven political statements, and asked to rate their level of agreement on a five-point Likert scale. They were also asked to check off the news sources they view on a regular basis. Using data from Pew and AllSides, each news source was tagged with its degree of liberal or conservative bias. It was hypothesized that people who only use polarized media sources will have answers towards one or five on the scale, corresponding to extreme opinions on social and political issues. Conversely, people who use a variety of media sources were hypothesized to have more moderate views. Analysis is still underway, but statistically significant findings have been made connecting extreme news sources to extreme political views (ANOVA p-value = 0.0063). There is a decrease in individual extremeness as the average source score gets closer to zero. In other words, in this survey, people who view neutral news sources have less extreme political views. This research draws conclusions about the population represented in this survey and helps gain insight into the political polarization so prevalent in our country today.Bibliography/Citations:
James N. Druckman and Michael Parkin, "The Impact of Media Bias: How Editorial Slant Affects Voters," The Journal of Politics 67, no. 4 (November 2005): 1030-1049.
Knight Foundation. knightfoundation.org. Accessed 7 June 2019.
Martin, Gregory J., and Ali Yurukoglu. 2017. "Bias in Cable News: Persuasion and Polarization." American Economic Review, 107. Accessed 30 September 2019.
Mitchell, Amy, et al. "Pathways to News." Pew Researcher Center. Pew Research Center, www.journalism.org/2016/07/07/pathways-to-news/. Accessed 7 June 2019.
Pew Research Center. 26 Mar. 2019, www.journalism.org/interactives/local-news-habits/45940/. Accessed 19 June 2019.
Relman, Eliza. "Business Insider." Business Insider, 21 June 2018, www.businessinsider.com/most-and-least-biased-news-outlets-in-america-2018-6. Accessed 19 June 2019.
AllSides. “Media Bias Ratings AllSides.” allsides.com, 2021, https://www.allsides.com/media-bias/media-bias-ratings. Accessed 1 March 2021.
United States Census Bureau. “US Census.” Census.gov, 2020, https://www.census.gov/. Accessed February 2020
Additional Project Information
Project files
Research Plan:
The first step of this research project was to distribute surveys (Appendix 1) to adults across the country using Google Forms. It was sent to people around the United States through email chains and social media.
The surveys first asked participants for their consent. Once that was given, they were asked demographic questions: age, state, income, race, gender, and party affiliation. The next part of the survey asked them to rate political statements on a five-point Likert scale. The statements represented either an extreme conservative or liberal view (Ex: Abortion should be illegal.), alternating whether a rating of one or five was associated with the expected liberal or conservative viewpoint. Then, respondents were given a list of media sources and were asked to check the box of each one they look at on a regular basis and how often.
The survey was open for two weeks and afterwards analysis began. Upon receiving all of the responses, data from Pew Research Center and AllSides was used to tag each news source with its degree of liberal or conservative bias on scale from negative two to positive two-2 to 2. Python and Excel were used for data analysis. The main variables considered for comparison were ones relating political and news source bias. Demographic variables were also observed and analyzed. For statistical analysis, the ANOVA and Tukey HSD tests were used.
Questions and Answers
1. What was the major objective of your project and what was your plan to achieve it?
The major objective of my project was to gain insight on how news sources (the amount and extremeness) effect the extremeness of political views.
a. Was that goal the result of any specific situation, experience, or problem you encountered?
The goal was mainly the result of the tensions within my family relating to politics. I saw that different members of my family who had different views relied on very different media sources and I wanted to research it.
b. Were you trying to solve a problem, answer a question, or test a hypothesis?
I wanted to test my hypothesis that the news sources people look at on a regular basis not only effect their political views, but also the extremeness of them. And if their views are more moderate, if they look at a wider range of sources.
2. What were the major tasks you had to perform in order to complete your project?
The major tasks were developing the survey, distributing the survey, and analyzing my results. I developed the survey with the help of a professor and distributed it using Google Forms and by sending it to as many people as possible and having them send it too (ended up with over 1,000 responses). Once I collected the responses I used Python for awhile to begin analyzing but have ended up using mostly Excel.
a. For teams, describe what each member worked on.
3. What is new or novel about your project?
There has been research before on news sources and how they effect political views but I think my survey is fairly unique in that it asks many questions about demographics, politics, and news sources.
a. Is there some aspect of your project's objective, or how you achieved it that you haven't done before?
Personally, I had never done a research project before, so all aspects of my project were new to me and I had to learn a lot as I went about surveying and analyzing data.
b. Is your project's objective, or the way you implemented it, different from anything you have seen?
c. If you believe your work to be unique in some way, what research have you done to confirm that it is?
4. What was the most challenging part of completing your project?
The most challenging part of completing my project has been in analyzing my data.
a. What problems did you encounter, and how did you overcome them?
At first I used Python but did not end up having the easiest time presenting my data in graphs and charts. I then switched to Excel but because I do not have that much experience with it, I am constantly learning new things about it which takes a lot of time. My biggest problems have been with manipulating my data and finding ways to prove my hypothesis with different statistics, variables, and charts.
b. What did you learn from overcoming these problems?
I have learned a lot not only about Excel, but the different ways to go about proving that data is significant and different tests that can be run. I also have learned the importance of keeping all data very organized and storing it in ways that are easy to move around and manipulate.
5. If you were going to do this project again, are there any things you would you do differently the next time?
I would make sure that I had not only my teacher (who has been extremely helpful) but also a professor/mentor that would be able to stay with me through the entire process. The professor I consulted with unfortunately was not able to do this so it proved to be more difficult come time to analyze my data since I did not have experience doing so.
6. Did working on this project give you any ideas for other projects?
At the moment I do not have new ideas for other projects, but do have ideas on how to further my current one. While I began to try and find relationships between news sources and political views ( and I am still doing this), I am beginning to look into comparing different variables with the demographic information that I collected. I am doing this right now and hoping to find significant results.
7. How did COVID-19 affect the completion of your project?
It has affected the completion of my project because I am not in school everyday to talk to my teachers which is very helpful and it has also limited my class time on Zoom too.